# Live Activity Monitoring
> Learn about the F5 DoS for NGINX Live Activity Monitoring.
## Overview
F5 DoS for NGINX offers a variety of application monitoring tools:
- **App Protect DoS Dashboard Page**: This dynamic interface provides real-time monitoring and details of Protected Objects.
- **F5 DoS for NGINX REST API**: This interface offers comprehensive metrics about the Protected Objects.
## Prerequisites
- NGINX Plus R26 or later is required for accessing the F5 DoS for NGINX REST API and the DoS Dashboard.
## API Configuration Steps
To activate the API:
- Define a `server` block within the `http` context to handle the API:
```nginx
http {
server {
# insert your API configuration here
}
}
```
- Create a `location` for API requests and include the `app_protect_dos_api` directive:
```nginx
http {
# ...
server {
listen 192.168.1.23;
# ...
location /api {
app_protect_dos_api;
# ...
}
}
}
```
- Limit API location access, for example, permit only local network access using `allow` and `deny` directives:
```nginx
http {
# ...
server {
listen 192.168.1.23;
# ...
location /api {
app_protect_dos_api;
allow 192.168.1.0/24;
deny all;
}
}
}
```
- Implement HTTP basic authentication to restrict access to PATCH, POST, and DELETE methods to certain users:
```nginx
http {
# ...
server {
listen 192.168.1.23;
# ...
location /api {
limit_except GET {
auth_basic "NGINX Plus API";
auth_basic_user_file /path/to/passwd/file;
}
app_protect_dos_api;
allow 192.168.1.0/24;
deny all;
}
}
}
```
- Enable the DoS Dashboard by defining the /dashboard-dos.html location, which is typically in the root directory:
```nginx
http {
# ...
server {
listen 192.168.1.23;
# ...
location /api {
limit_except GET {
auth_basic "NGINX Plus API";
auth_basic_user_file /path/to/passwd/file;
}
app_protect_dos_api;
allow 192.168.1.0/24;
deny all;
}
location = /dashboard-dos.html {
root /usr/share/nginx/html;
}
}
}
```
## Use the Dashboard
### Access the Dashboard
To view the Dashboard, enter the corresponding address in your browser's address bar.
For example, "http://192.168.1.23/dashboard-dos.html" will show the Dashboard page located in /usr/share/nginx/html as indicated in the root directive.
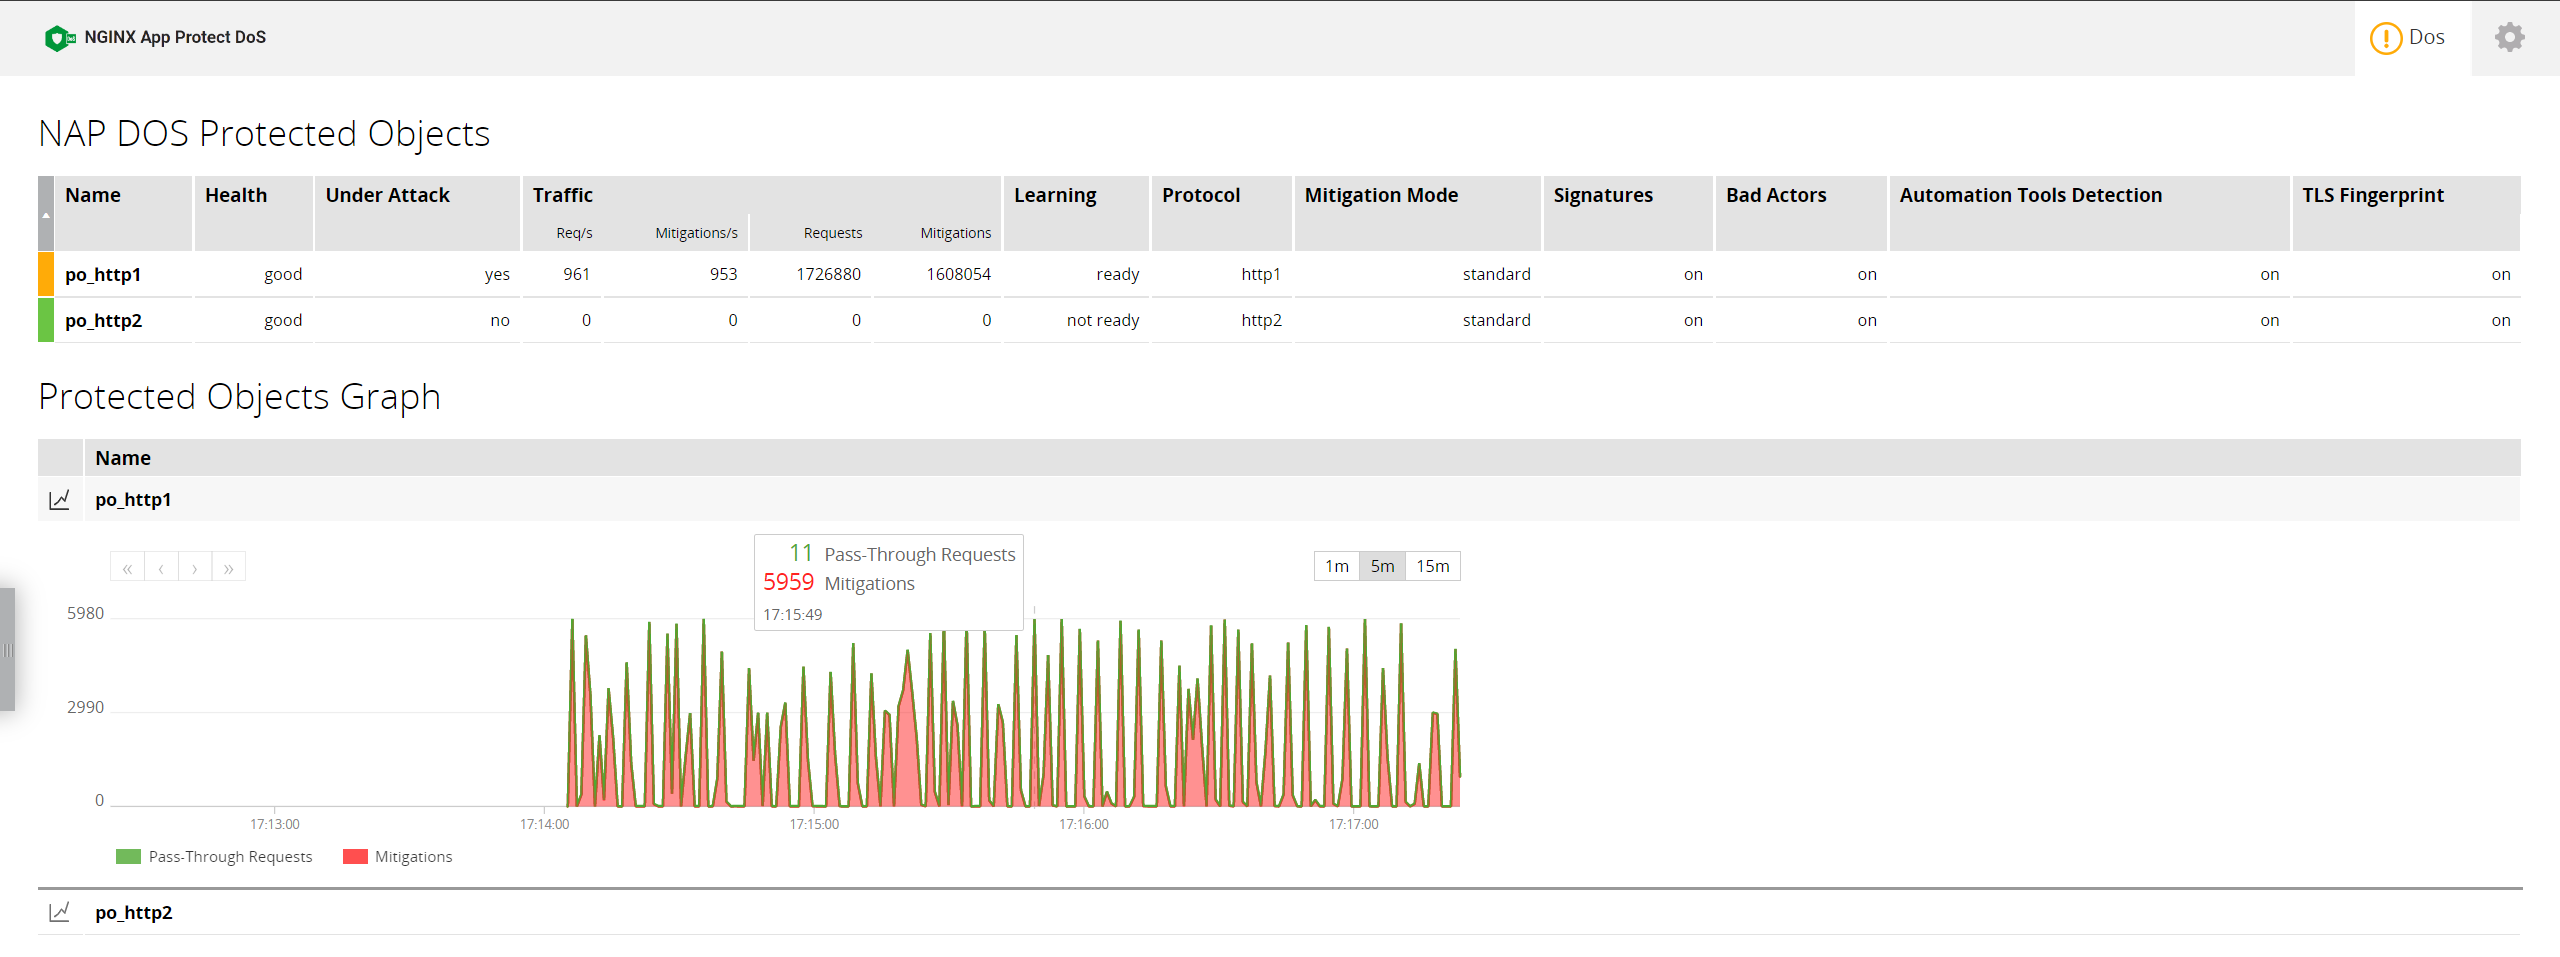
### DoS Tab Overview
The **DoS** tab displays real-time statistics, settings, and traffic graphs for each Protected Object.
In multi-instance environments with an arbitrator, these statistics will be combined.
| Metric name | Values | Description |
|:--------------- |:------- |:-----------|
| Name | - | The name of the Protected Object, as defined by the `app_protect_dos_name` directive (or auto-generated if not present) |
| Health | [good\|bad] | The health of the backend server, as defined by the `uri` argument of the `app_protect_dos_monitor` directive |
| Under Attack | [yes\|no] | Whether the Protected Object is under attack or not |
| Req/s | - | Number of incoming requests per second |
| Mitigations/s | - | Number of mitigated requests per second |
| Requests | - | Total number of incoming requests |
| Mitigations | - | Total number of mitigated requests |
| Learning | [ready\|ba only\|not ready] | Whether F5 DoS for NGINX collected enough data to protect the Protected Object. Note: `ba only` means that request thresholds were learned, but full request sampling is not complete. In this status, F5 DoS for NGINX will only detect bad actors (by IP or IP+TLS fingerprint) and will not utilize mitigation signatures. |
| Protocol | [http1\|http2\|grpc] | As defined by the `protocol` argument of the `app_protect_dos_monitor` directive |
| Mitigation Mode | [standard\|conservative\|none] | As defined by the `mitigation_mode` object in the JSON policy file from the `app_protect_dos_policy_file` directive |
| Signatures | [on\|off] | As defined by the `signatures` object in the JSON policy file from the `app_protect_dos_policy_file` directive. Values - on/off |
| Bad Actors | [on\|off] | As defined by the `bad_actors` object in the JSON policy file from the `app_protect_dos_policy_file` directive |
| Automation Tools Detection | [on\|off] | As defined by the `automation_tools_detection` object in the JSON policy file from the `app_protect_dos_policy_file` directive |
| TLS Fingerprint| [on\|off] | As defined by the `tls_fingerprint` object in the JSON policy file from the `app_protect_dos_policy_file` directive |
### Graph Representation
The displayed graph is a stacked composition, encompassing two specific metrics: `Passthrough Requests` and `Mitigations`, with both metrics measured on a per-second basis.
- `Passthrough Requests` represents the count of requests successfully forwarded to the backend server.
- `Mitigations` indicates the quantity of requests that have been mitigated.
The sum of these two metrics at any given moment provides the aggregate count of incoming requests.
### Status Color Indicators
- **Green**: Indicates a normal state, with no attack and optimal server health.
- **Yellow**: Indicates the presence of either an active attack or diminished server health.
- **Red**: Indicates a severe scenario, where the object is experiencing an attack combined with poor health.
### Configure Dashboard Options
You can configure the dashboard by clicking the Gear button in the Tabs menu.
**Update every N sec** - updates the Dashboard data after the specified number of seconds, default is 1 second.
## Use the REST API
Statistics of your server infrastructure can be managed with the REST API interface. The API is based on standard HTTP requests: statistics can be obtained with `GET` requests.
The requests are sent in the JSON format that allows you to connect the stats to monitoring tools or dashboards that support JSON.
The status information of any element can be accessed with a slash-separated URL. The URL may look as follows:
`http://192.168.1.23/api/dos/1/protected_objects`
where:
- `/api` represents the configured endpoint in your NGINX setup for API access.
- `/dos` differentiates the App Protect DoS API from other NGINX Plus APIs.
- `/1` indicates the API version you are using, with the current version being 1.
- `/protected_objects` points to the specific resource or data you want to access.
Responses from the API are in JSON format for easy parsing and analysis.
To view all primary endpoints, use a GET request via 'curl' in the terminal:
```shell
curl -s 'http://192.168.1.23/api/dos/1/' | json_pp
```
This command returns a JSON array listing the main access points, like:
```json
["protected_objects"]
```
For obtaining detailed statistics about a particular endpoint, execute a similar GET request:
```shell
curl -s 'http://192.168.1.23/api/dos/1/protected_objects' | json_pp
```
### APIs overview
#### Endpoints
| Path | Description |
|:------ |:-----------|
| / | Return list of root endpoints |
| /protected_objects/ | Return statistics of all Protected Objects |
| /protected_objects/{protectedObjectName} | Return statistics of a Protected Object |
An example response from the `/protected_objects` endpoint could be:
```json
{
"po_1": {
"attack": false,
"health": 0.50,
"rps": 12,
"mps": 0,
"requests": 500123,
"passthrough": 260023,
"mitigations": 240100,
"learning": "ready",
"protocol": "http1",
"mode": "standard",
"sig": true,
"ba": true,
"auto_tools": true,
"tls_fp": true
},
"po_http2": {
"attack": false,
"health": 0.50,
"rps": 20,
"mps": 0,
"requests": 500123,
"passthrough": 260023,
"mitigations": 240100,
"learning": "not_ready",
"protocol": "http2",
"mode": "conservative",
"sig": true,
"ba": true,
"auto_tools": true,
"tls_fp": true
},
"po_grpc": {
"attack": false,
"health": 0.50,
"rps": 25,
"mps": 0,
"requests": 6000123,
"passthrough": 2599123,
"mitigations": 3401000,
"learning": "ready",
"protocol": "grpc",
"mode": "standard",
"sig": true,
"ba": true,
"auto_tools": true,
"tls_fp": true
}
}
```