Access the NGINX Plus dashboard
This topic describes how to view the NGINX Plus dashboard to see real-time metrics.
The NGINX Plus dashboard offers a real-time live activity monitoring interface that shows key load and performance metrics of your server infrastructure.
The dashboard is enabled by default for NGINX Gateway Fabric deployments that use NGINX Plus as the data plane, and is available on port 8765.
To access the dashboard, you will first need to forward connections to port 8765 on your local machine to port 8765 on the NGINX Plus pod (replace <nginx-plus-pod> with the actual name of the pod).
kubectl port-forward <nginx-plus-pod> 8765:8765 -n <nginx-plus-pod-namespace>Afterwards, use a browser to access http://127.0.0.1:8765/dashboard.html to view the dashboard.
The dashboard will look like this:
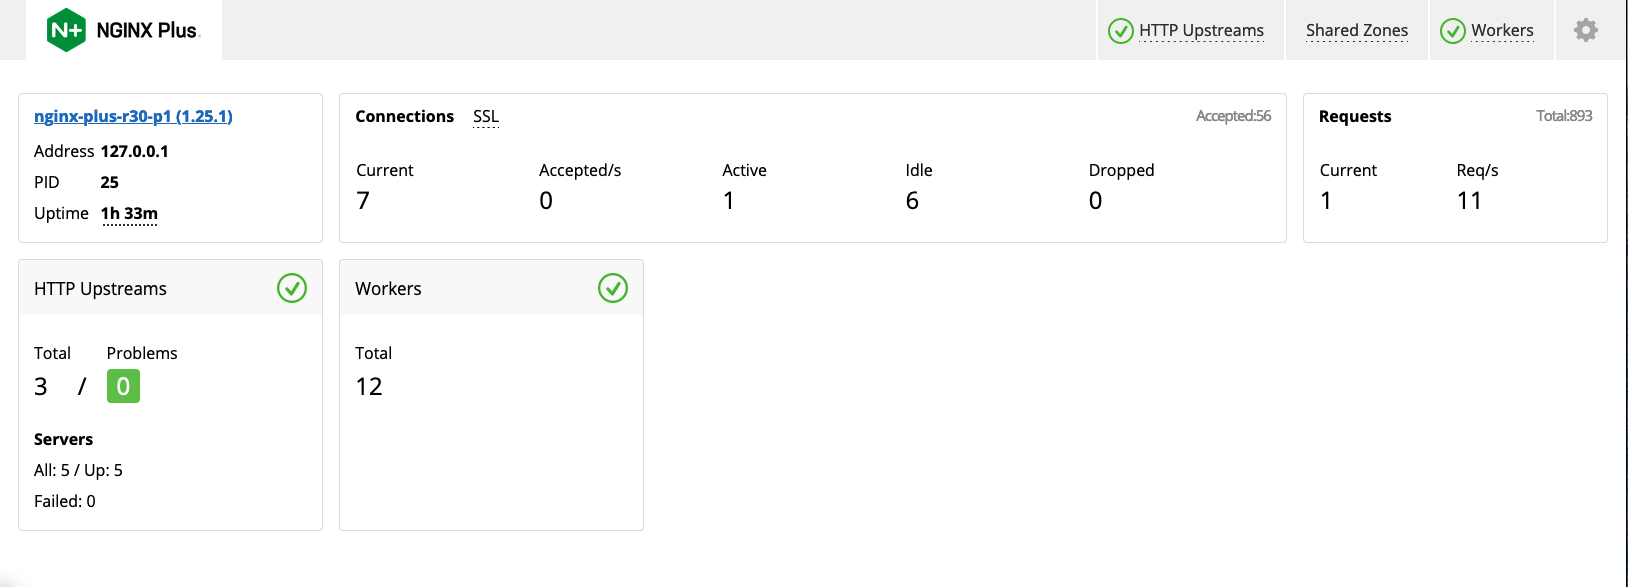
Note: The API used by the dashboard for metrics is also accessible using the/apipath.
To access the NGINX Plus dashboard from sources than the default 127.0.0.1, you can use the NginxProxy resource to allow access to other IP Addresses or CIDR blocks.
The following example configuration allows access to the NGINX Plus dashboard from the IP Addresses 192.0.2.8 and
192.0.2.0 and the CIDR block 198.51.100.0/24:
apiVersion: gateway.nginx.org/v1alpha1
kind: NginxProxy
metadata:
   name: ngf-proxy-config
spec:
   nginxPlus:
      allowedAddresses:
         - type: IPAddress
           value: 192.0.2.8
         - type: IPAddress
           value: 192.0.2.0
         - type: CIDR
value: 198.51.100.0/24For more information on configuring the NginxProxy resource, visit the data plane configuration document.