Review metrics on the NGINX One dashboard
After connecting your NGINX instances to NGINX One, you can monitor their performance and health. The NGINX One dashboard is designed for this purpose, offering an easy-to-use interface.
- Log in to F5 Distributed Console.
- Select NGINX One > Visit Service.
Navigating the dashboard:
- Drill down into specifics: For in-depth information on a specific metric, like expiring certificates, click on the relevant link in the metric’s card to go to a detailed overview page.
- Refine metric timeframe: Metrics show the last hour’s data by default. To view data from a different period, select the time interval you want from the drop-down menu.
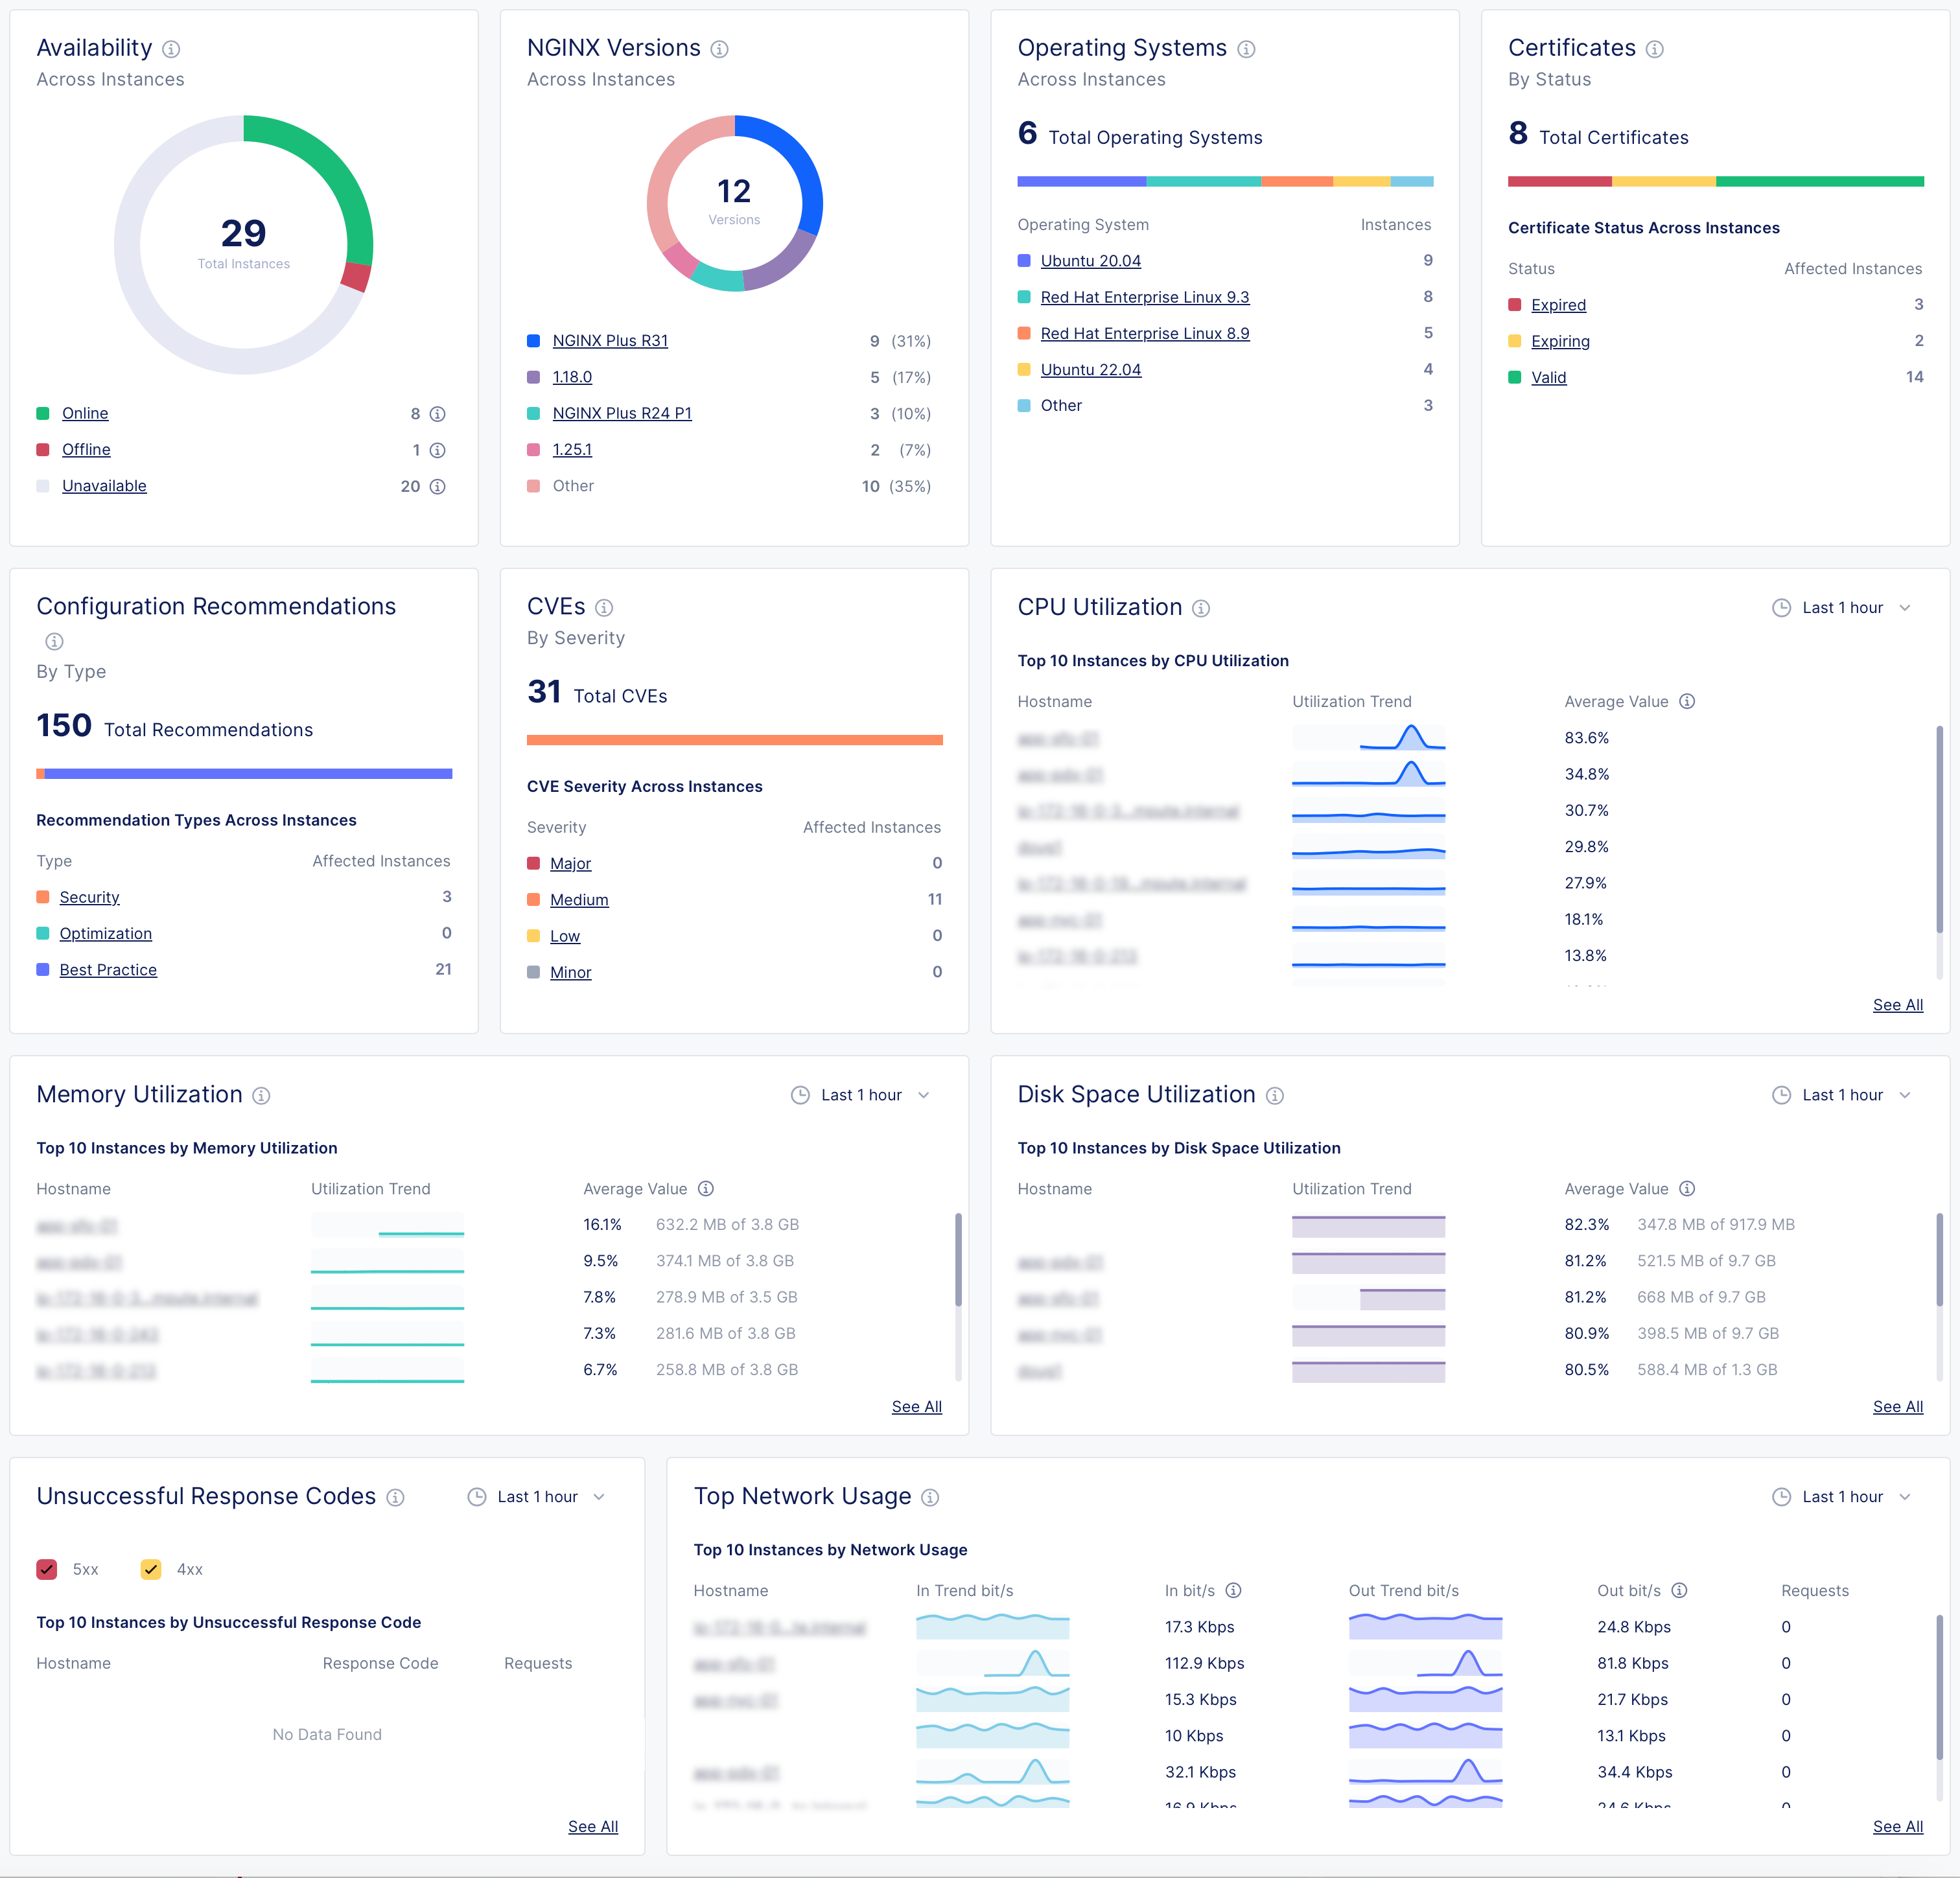
NGINX One dashboard metrics
| Metric | Description | Details |
|---|---|---|
| Instance availability | Understand the operational status of your NGINX instances. | - Online: The NGINX instance is actively connected and functioning properly. - Offline: NGINX Agent is connected but the NGINX instance isn’t running, isn’t installed, or can’t communicate with NGINX Agent. - Unavailable: The connection between NGINX Agent and NGINX One has been lost or the instance has been decommissioned. - Unknown: The current state can’t be determined at the moment. |
| NGINX versions by instance | See which NGINX versions are in use across your instances. | |
| Operating systems | Find out which operating systems your instances are running on. | |
| Certificates | Monitor the status of your SSL certificates to know which are expiring soon and which are still valid. | |
| Config recommendations | Get configuration recommendations to optimize your instances’ settings. | |
| CVEs (Common Vulnerabilities and Exposures) | Evaluate the severity and number of potential security threats in your instances. | - Major: Indicates a high-severity threat that needs immediate attention. - Medium: Implies a moderate threat level. - Minor and Low: Represent less critical issues that still require monitoring. - Other: Encompasses any threats that don’t fit the standard categories. |
| CPU utilization | Track CPU usage trends and pinpoint instances with high CPU demand. | |
| Memory utilization | Watch memory usage patterns to identify instances using significant memory. | |
| Disk space utilization | Monitor how much disk space your instances are using and identify those nearing capacity. | |
| Unsuccessful response codes | Look for instances with a high number of HTTP server errors and investigate their error codes. | |
| Top network usage | Review the network usage and bandwidth consumption of your instances. |