Lab 3: Explore NGINX One Console features
In this lab, you’ll explore and use key NGINX One Console features:
- Overview dashboard
- TLS certificate management
- Configuration recommendations
- CVE scanning
- AI Assistant for configuration insights
You’ll see how each feature helps you monitor and secure your NGINX fleet without writing custom scripts.
By the end of this tutorial, you can:
- Navigate the Overview Dashboard panels
- View and filter certificate status
- Review and apply configuration recommendations
- Investigate CVEs and open details
- Use the AI Assistant to explain directives and variables
Make sure you have:
All labs require an F5 Distributed Cloud (XC) account with NGINX One enabled. If you don’t have an account or need to verify access, follow the steps in Lab 1: Before you begin.
- All containers from Lab 2: Run workshop components with Docker running and registered
Set these environment variables:
-
TOKEN: your data plane key, for example:
export TOKEN="your-data-plane-key" -
JWT: your NGINX Plus license JWT. Save it as
nginx-repo.jwt, then run:export JWT=$(cat path/to/nginx-repo.jwt) -
NAME: a unique ID for your workshop (for example,
s.jobs):export NAME="s.jobs"
-
- Basic NGINX and Linux knowledge
Open NGINX One Console and select Overview. Here are the key metrics and what they mean:
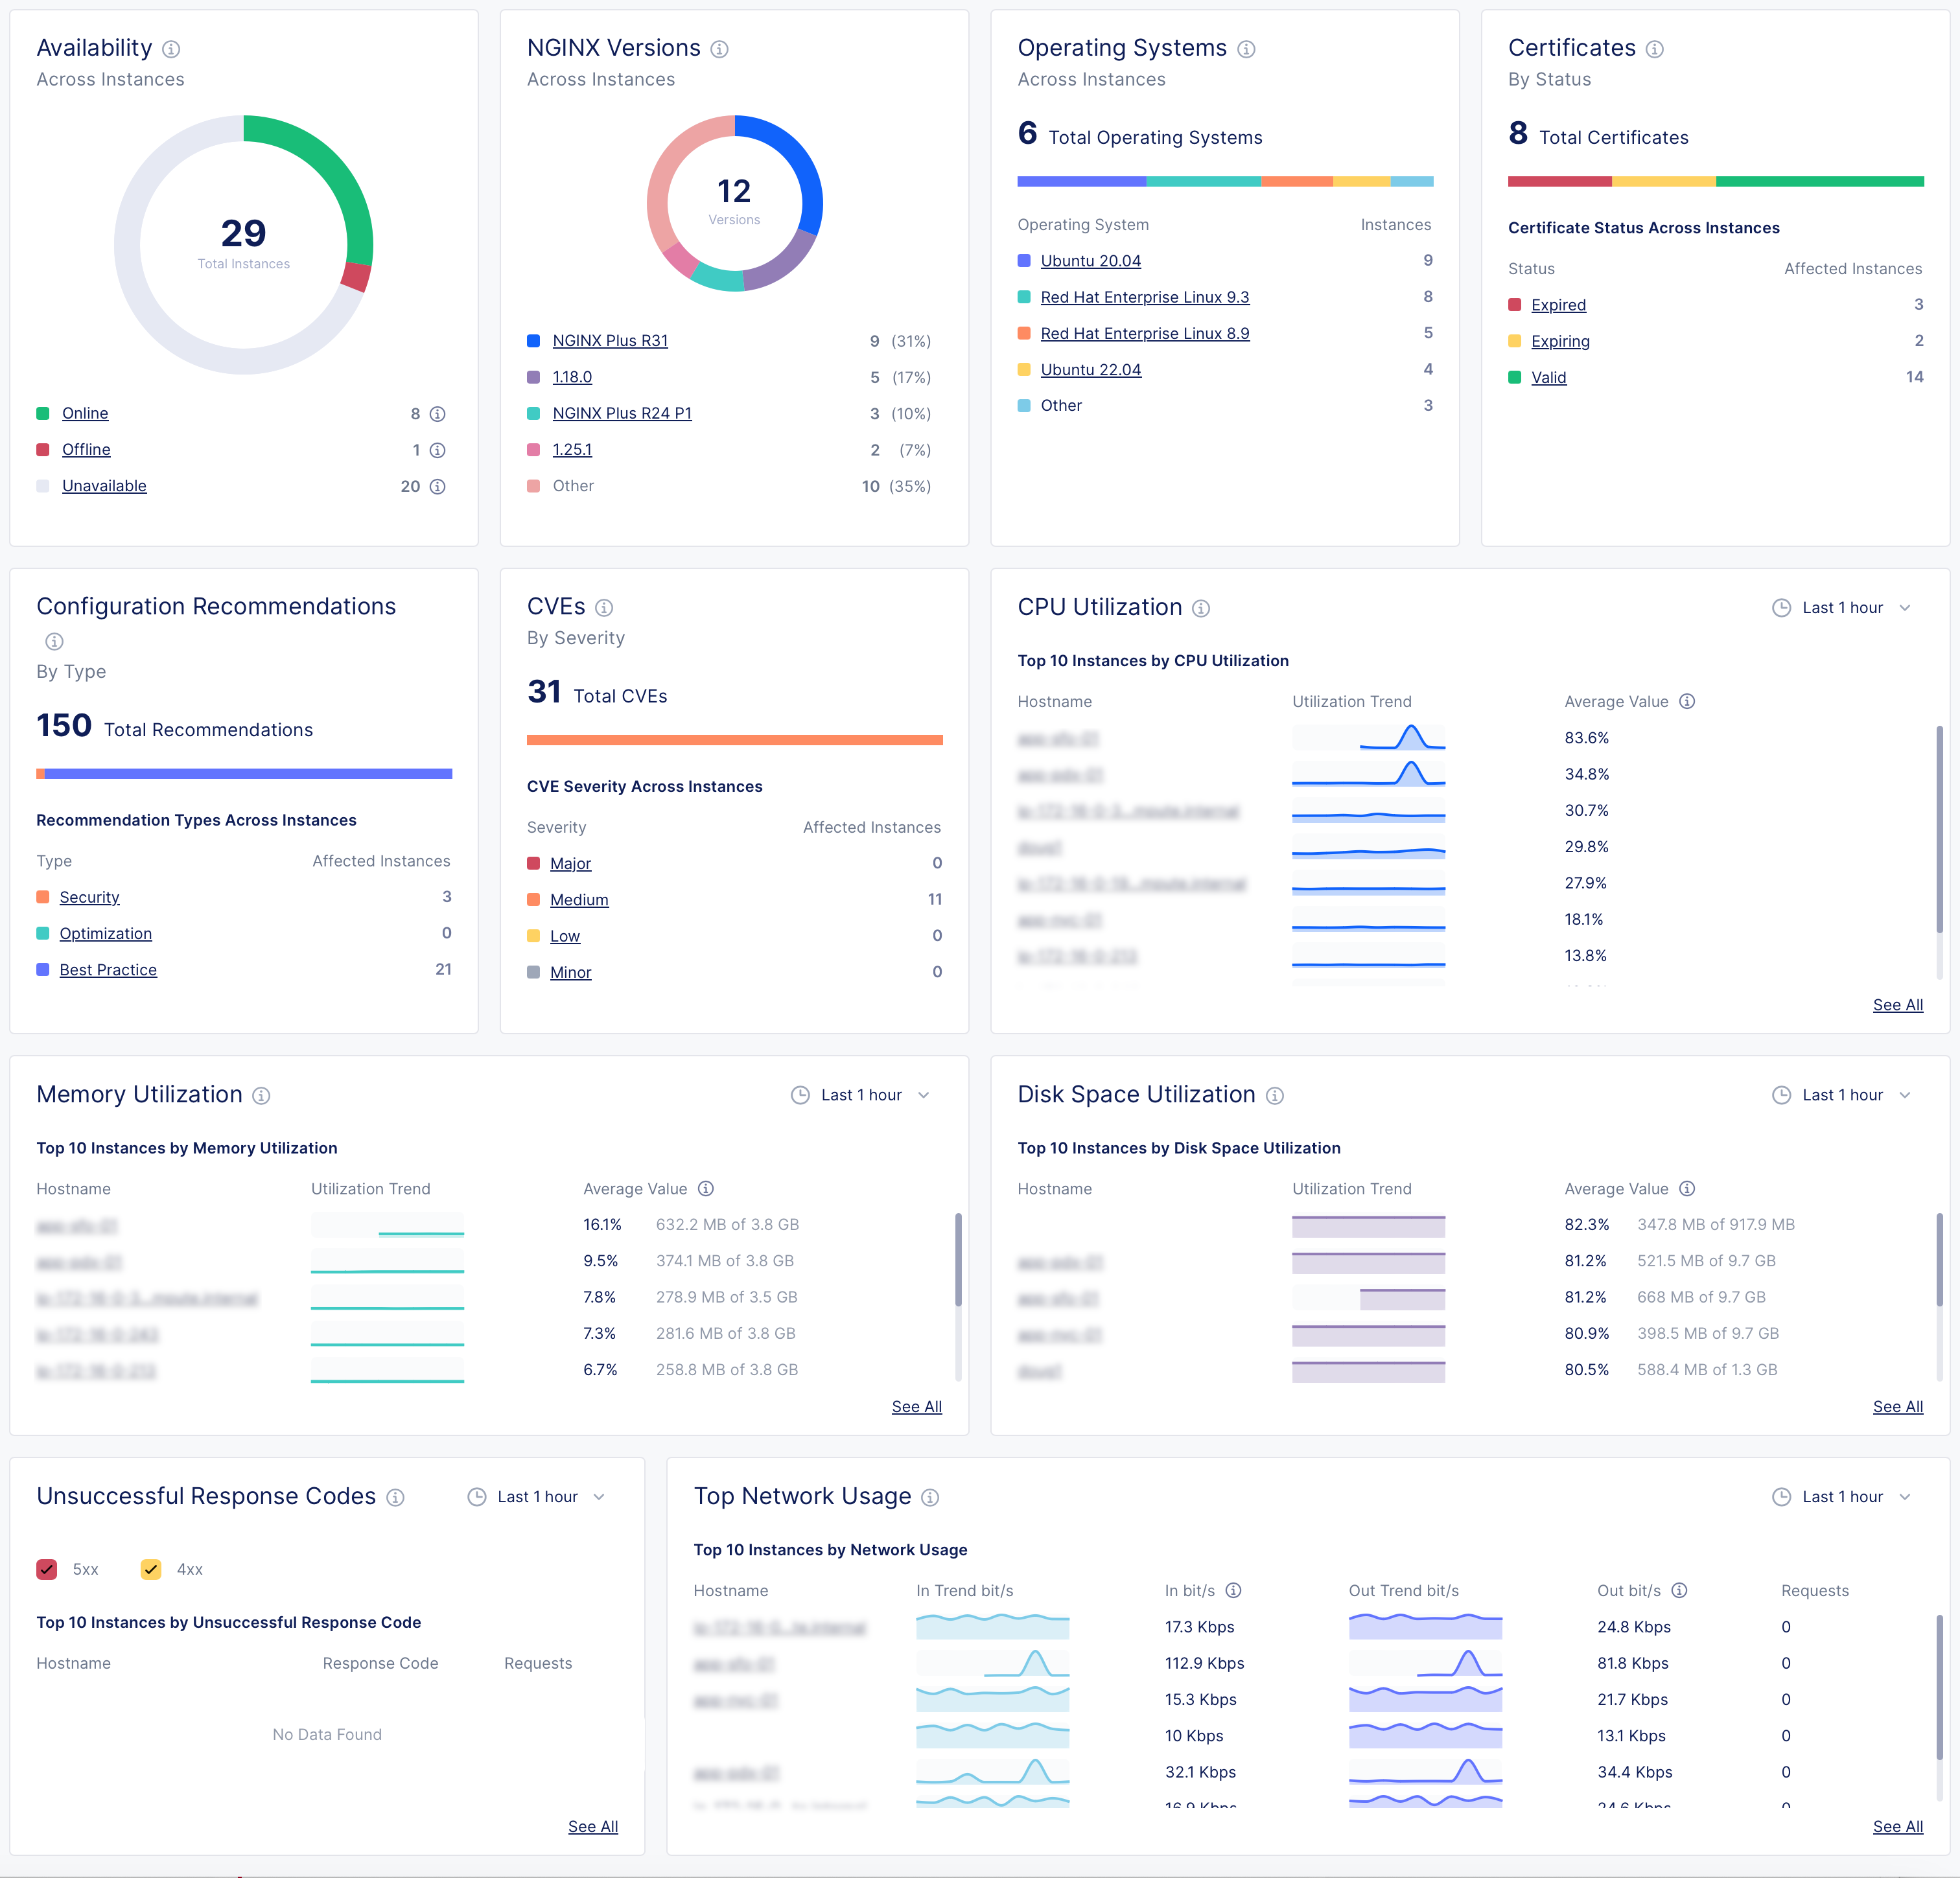
-
Instance availability
- Online: NGINX Agent and NGINX are connected and working
- Offline: NGINX Agent is running, but NGINX isn’t installed, isn’t running, or can’t connect
- Unavailable: NGINX Agent lost connection or instance was removed
- Unknown: Current state can’t be determined
-
NGINX versions by instance
See which NGINX Open Source or NGINX Plus versions your instances are running. -
Operating systems
View the Linux distributions in use. -
Certificates
Monitor SSL certificates, including expiring soon or still valid. -
Configuration recommendations
Get suggestions to improve security, performance, and best practices. -
CVEs (Common Vulnerabilities and Exposures)
Review threats by severity:- Major: fix immediately
- Medium: play to fix soon
- Low/Minor: monitor
- Other: any non-standard categories
-
CPU utilization
Track which instances use the most CPU over time. -
Memory utilization
Monitor which instances consume the most RAM. -
Disk space utilization
See which instances are nearing full disk capacity. -
Unsuccessful response codes
Spot instances with high counts of HTTP 4xx or 5xx errors. -
Top network usage
Review inbound and outbound network traffic trends.
Use the CVEs panel to investigate vulnerabilities:
- In the CVEs panel, select High to list instances with high-severity issues.
- Select your
$NAME-plus1instance to view CVE details, including ID, severity, and description. - Select any CVE ID (for example,
CVE-2024-39792) to open its official page with remediation guidance. - Switch to the Security tab to see every CVE NGINX One tracks, with the number of affected instances.
- Select View More next to a CVE name for a direct link to the CVE database.
The Certificates panel shows the total number of certificates and their status across all instances.
Note: NGINX One only scans certificates that are part of a running NGINX configuration.
Statuses include:
- Expired: The certificate expiration date has passed
- Expiring: The certificate expires within 30 days
- Valid: The certificate is not near expiration
- Not Ready: NGINX One can’t determine the status
Steps:
- In the Certificates panel, select Expiring to list certificates that will expire soon.
- Select your
$NAME-oss1instance and switch to the Unmanaged tab to see certificate name, status, expiration date, and subject. - Select a certificate name (for example,
30-day.crt) to open its details page. - Scroll to Placements to view all instances that use that certificate.
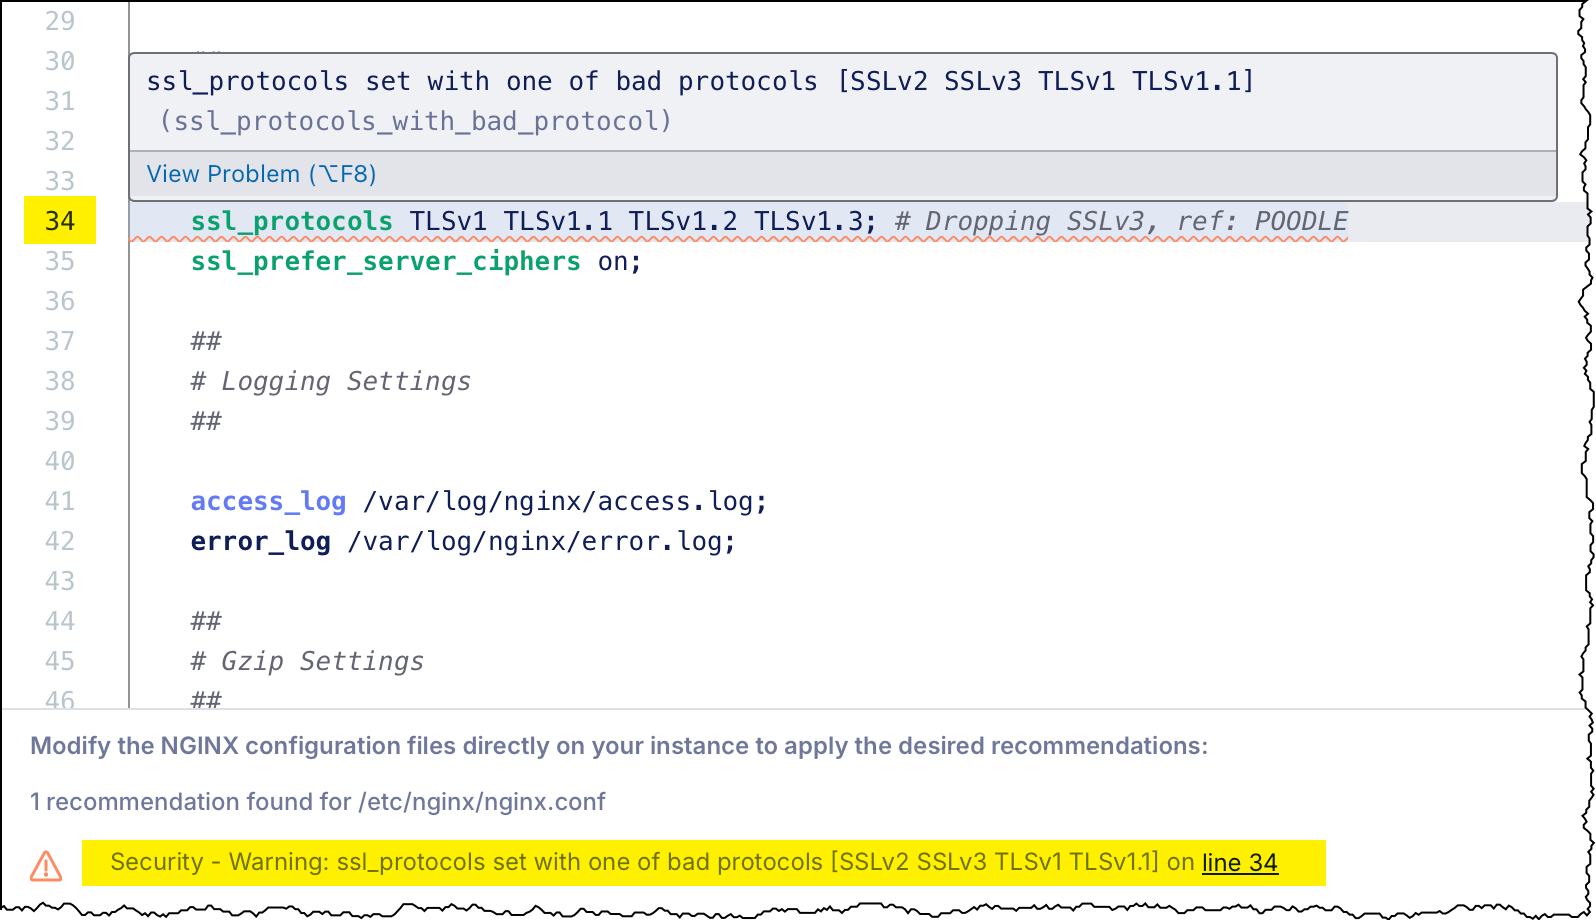
The Configuration Recommendations panel provides suggestions:
- Orange = Security
- Green = Optimization
- Blue = Best practices
- In NGINX One Console, go to Overview > Dashboard.
- In the Configuration Recommendations panel, select Security to view security-related suggestions.
- Select an instance hostname.
- Switch to the Configuration tab.
- Select a config file (for example,
cafe.example.com.conf) to see recommendations by line number. - Select Edit Configuration (pencil icon) to enter edit mode.
- Update the configuration to address each recommendation.
- Select Next to preview your changes, then select Save and Publish to apply them.
Highlight any configuration text, such as a directive, variable, or phrase, in a configuration preview and select Explain with AI.
The AI Assistant shows:
- A concise definition of the selected element
- Best-practice tips
- Guidance on common use cases
Try it on:
stub_statusproxy_buffering off$upstream_response_time
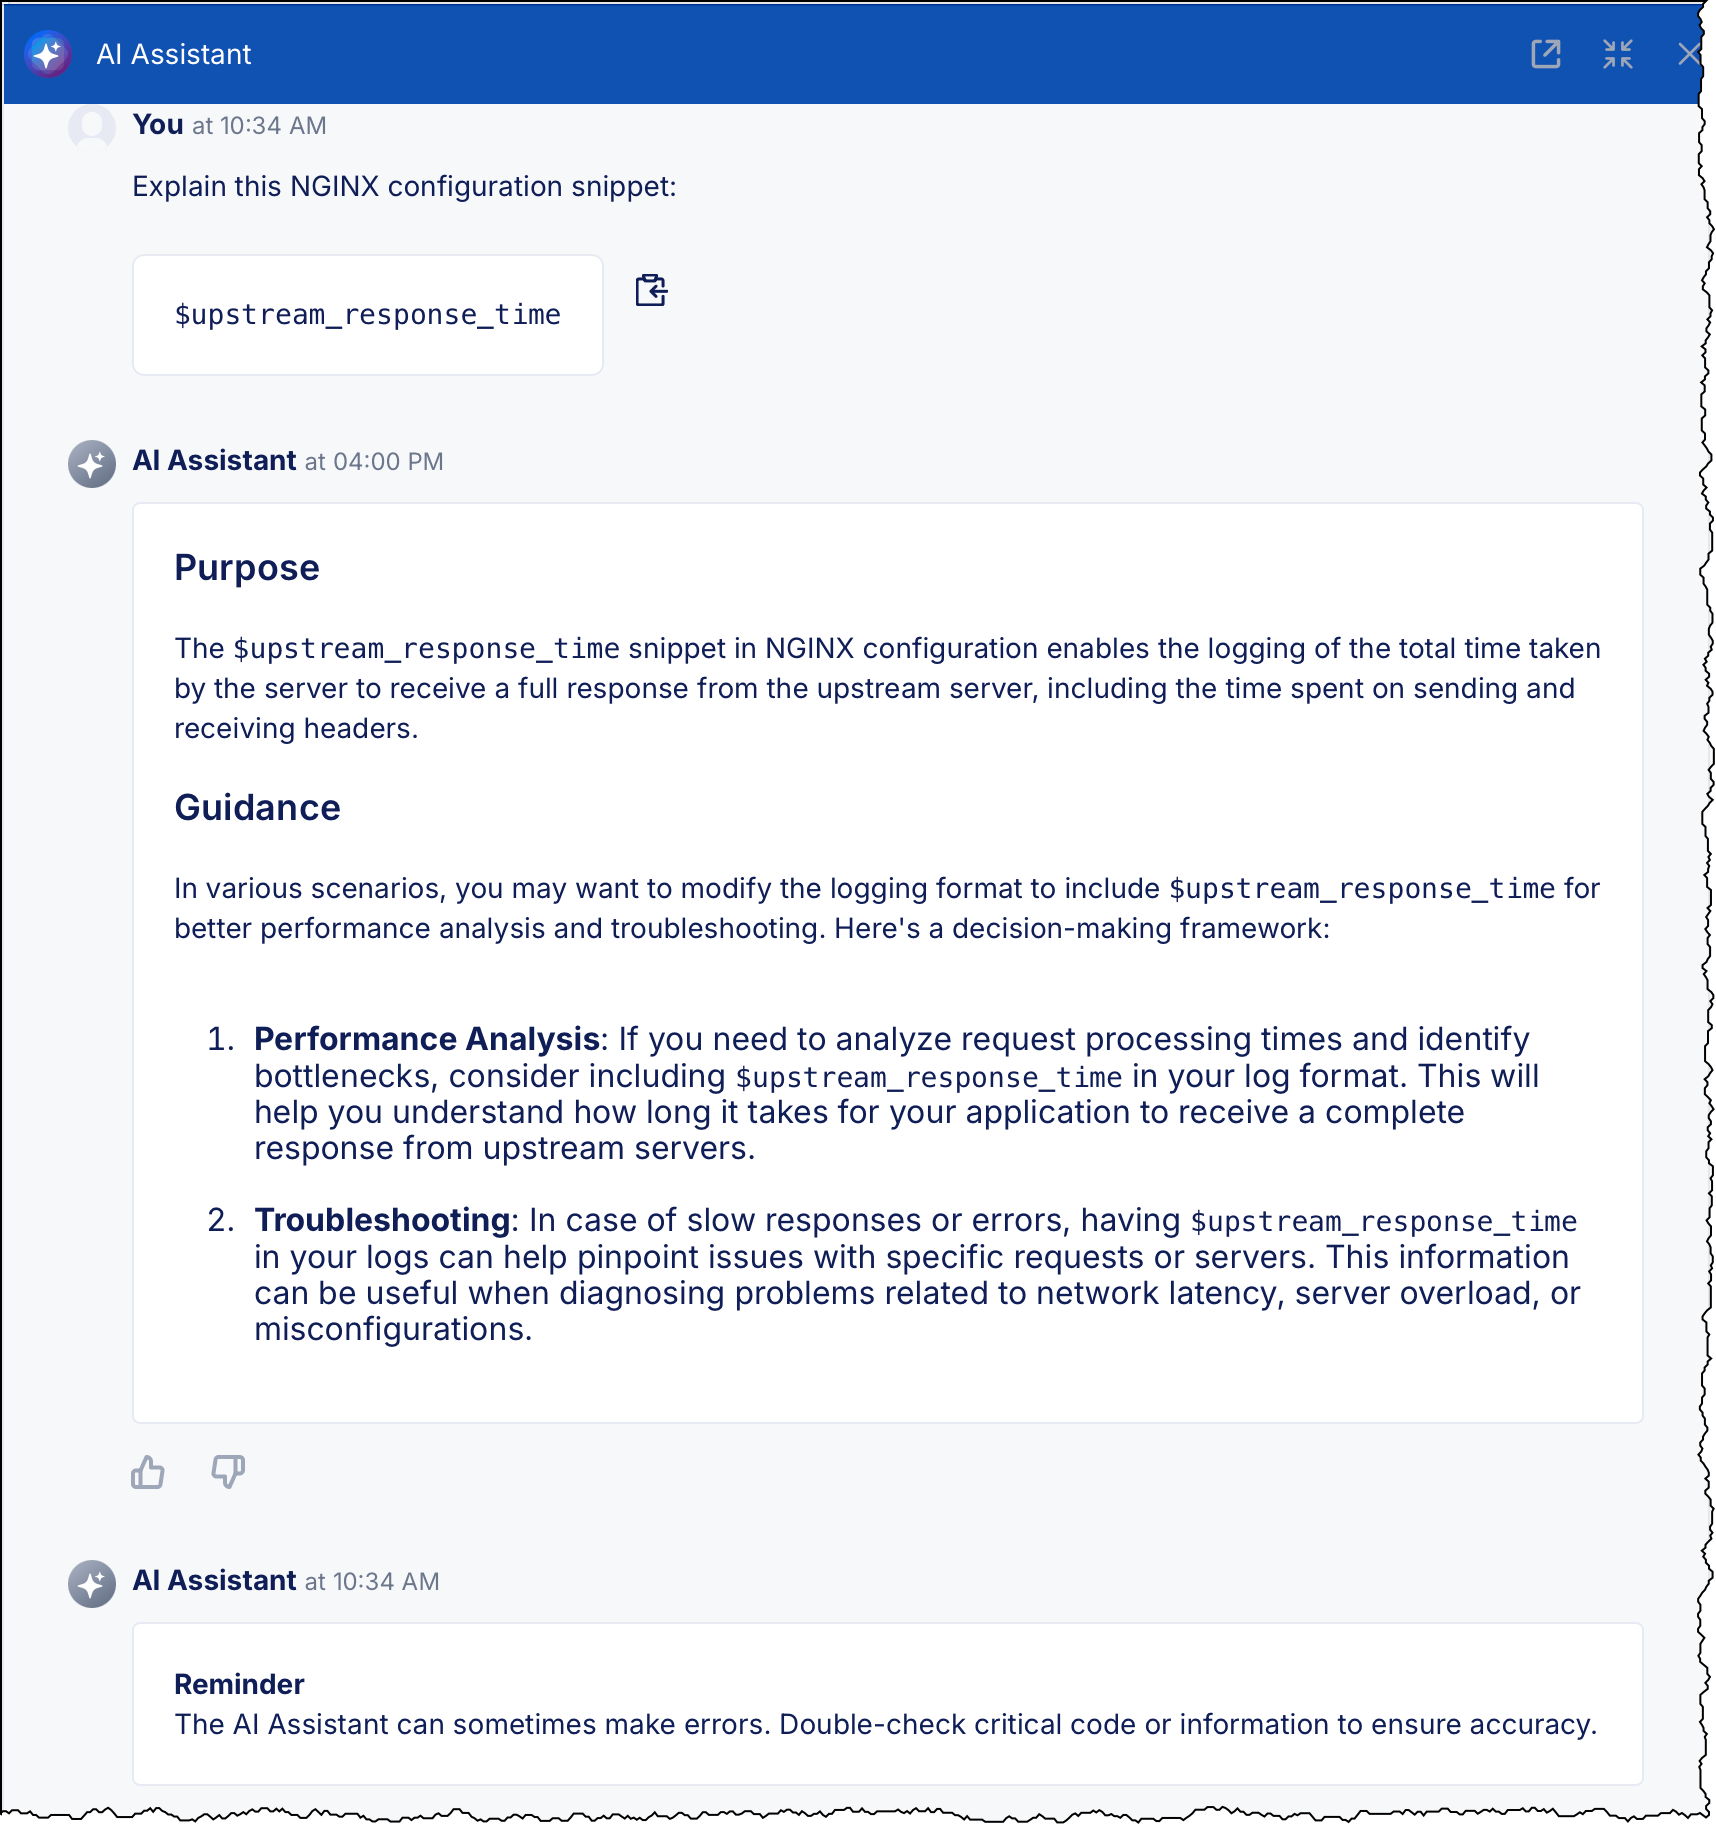
Pro tip: You can learn about NGINX directives and variables without leaving the Console.
You’re ready to apply configuration changes across your fleet using sync groups.
Go to Lab 4: Config Sync Groups.